 |
| Table 3; Comparing Service Expense Allocations Source: Audited Financial Statements |
Comparing Municipal Services
|
|
| Table 3; Comparing Service Expense Allocations Source: Audited Financial Statements |
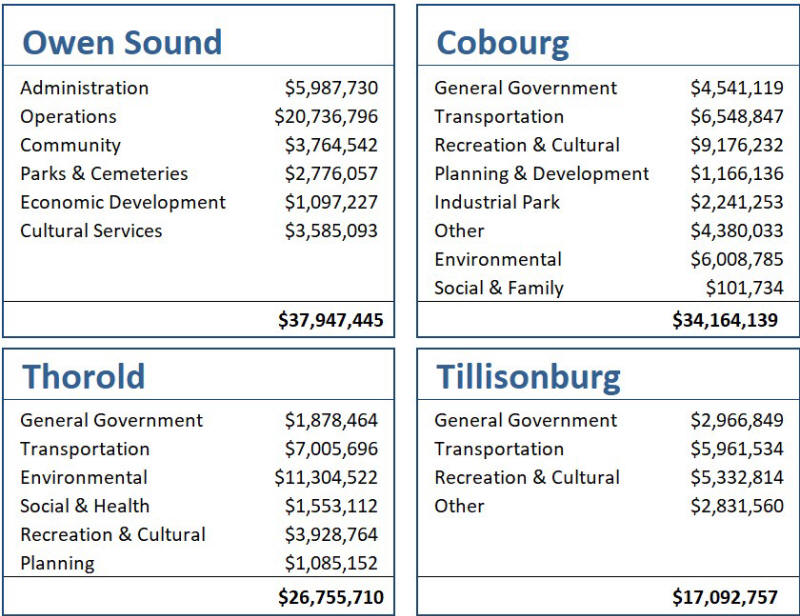
Table 3 shows how Owen Sound and the three primary comparator municipalities spend their money on services. Note that the comparator municipality that’s closest to Owen Sound’s characteristics, Cobourg, spends $3,783,306 less than Owen Sound on services. However, Cobourg’s Revenue from Taxation is $6,503,462 less than Owen Sound’s. This tells us that Cobourg is generating $2,720,156 more from other revenue sources than Owen Sound. This is largely due to Cobourg leveraging its assets to establish profit centers that contribute over $2 million in annual revenues.
Also of note is the relative cost of Administration or General Government. Owen
Sound spends nearly $1.5 million more in this area than Cobourg and $2.9 million
more than the average of the three primary comparator municipalities.
Transit
|
|
| Table 4; Comparing 2021 Transit Service Costs Source: 2021 Budget Statements 33 - 40 |
Five of the eight municipalities in the study group provide Transit Services.
The average of the three primary comparators is $902,539. Owen Sound’s costs in
2021 were close to the costs of the three primary comparators and only $249,771
above the average. It’s important to note when compared to Cobourg, the
municipality with nearly identical characteristics to Owen Sound, spent only
$83.287 less than Owen Sound in 2021. Therefore it’s safe to say that Transit is
not the problem.
In regard to bus fare costs Cobourg had the lowest fare costs in 2021 at $2.25 followed closely by Tillsonburg at $2.50, Thorold at $2.90 and Owen Sound at $3.00. Of note is that Thorold has a special weekend fare that is significantly higher than the weekday fare at $7.00 per ride. Perhaps this is something Owen Sound should consider.
Library
 |
| Table 5; Comparing Library Services Source: 2021 Budget Statements 33 - 40 |
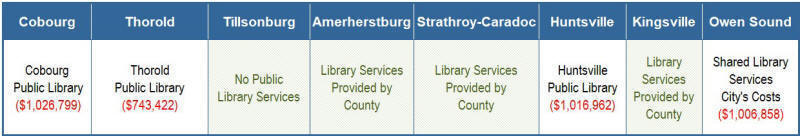
Only 50% of municipalities in the study group provide Library Services. The
average cost of Library Services for the two primary comparator municipalities
was $883,111 in 2021. In comparison Owen Sound’s cost was only slightly higher
at $1,006,858. Therefore it’s safe to say that Library Services are not a major
contributor to the excessive expenses problem.
Cultural Services
 |
| Table 6; Comparing Cultural Services Source: 2021 Budget Statements 33 - 40 |
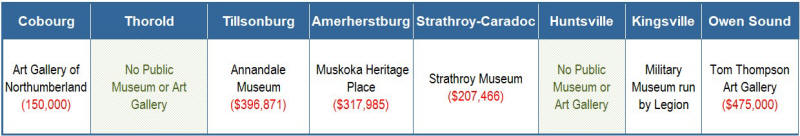
Six of the eight municipalities in the study group provided Cultural Services in the form of Museums or Art Galleries in 2021. The average of the two primary comparators that provide Cultural Services is $273,436. With a cost of $450,000, Owen Sound’s costs for the Art Gallery were close to double the average of the primary comparators in 2021. Therefore to some extent our Art Gallery does contribute to our expenses problem. However, when you consider our expenses are $11 million above average, the Art Gallery excessive expense does not significantly contribute to the overall problem.
Parks
 |
| Table 7; Comparing Municipal Parks and Green Spaces Source: Source: 2021 Budget Statements 33 - 40 |
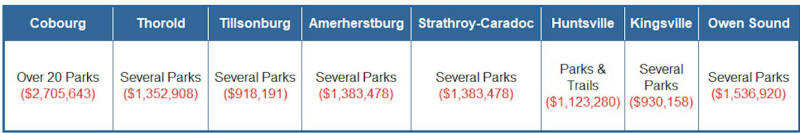
Of the eight municipalities in the study group, Cobourg spends by far the most
on maintaining their parks at $2.7 million which is almost double what Owen
Sound spends. The average of the three primary comparators was $1,658,914 in
2021.
Recreation
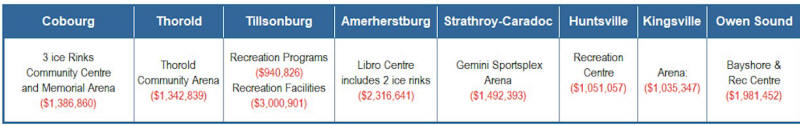 |
| Table 8; Comparing Municipal Recreation Facilities Source: Source: 2021 Budget Statements 33 - 40 |
In regard to maintaining recreation facilities the average of the primary
comparators in 2021 was $1,910,200. This is nearly identical to the $1,981,452
that Owen Sound spent that year. Therefore it’s safe to say that Owen Sound’s
recreation expenses are in line with the other comparator municipalities.
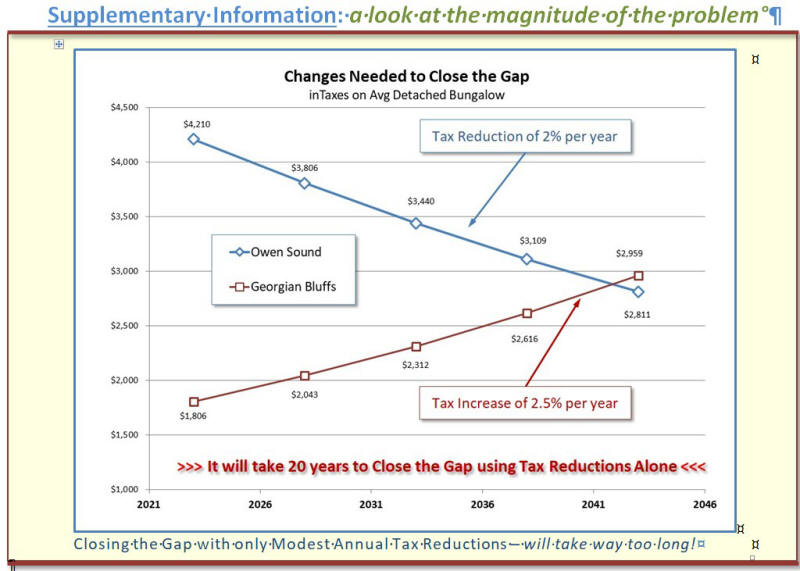
Supplementary Information: a look at the magnitude of the problem
 |
|
SUMMARY |
|
1. All municipalities in the study group largely provide the same services to some degree. 2. Library, Transit, Parks and Recreation services are on par with the other municipalities. 3. Owen Sound over-spending on Cultural Services is not a major contributor to the problem. 4. The absence of Profit Centers is negatively impacting the high taxes relative to the others |
| Read Why We Have Excessive Tax Growth |