 |
| Figure 25; Workforce Growth Relative to Population Growth (2011 – 2021) |
Comparing Workforce Growth
|
|
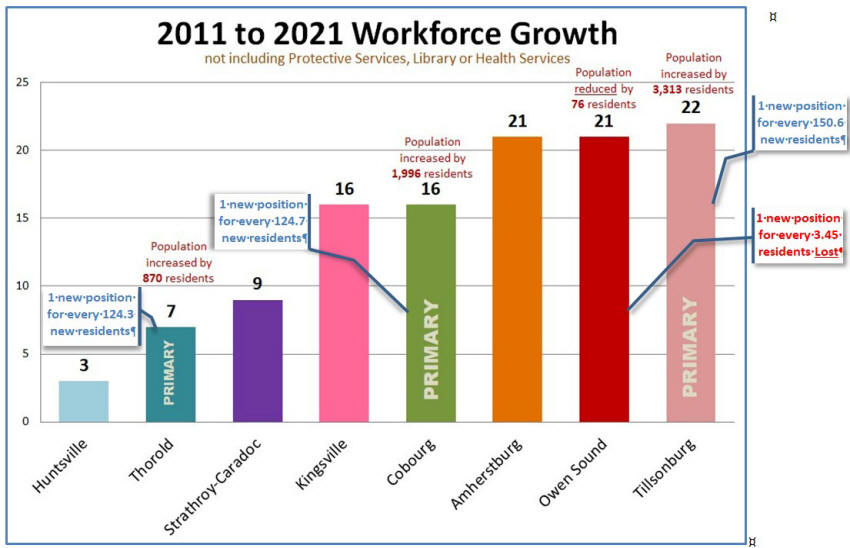
| Figure 25; Workforce Growth Relative to Population Growth (2011 – 2021) |
As shown in figure 25 above, the three primary comparators grew their workforces on average of 1 new position for every 133.2 new residents between 2011 and 2021. On the other hand, Owen Sound created one new position for every 3.45 residents who left the city.
If we assume that the primary factor driving staff growth is population growth, we can calculate what size the Owen Sound workforce should be based on population growth. The average staff growth of the primary comparators was 0.75% of population growth. Based on the above staff-population growth ratio, the Owen Sound workforce should have been reduced by 76 x 0.0075 = 0.57 employees. If we round that off to 1.0 then the workforce should have been reduced by one employee instead of growing by 22 employees. This means that based on a direct correlation between staff growth and population growth the Owen Sound workforce is overstaffed by 23 employees.
The question is has Owen Sound’s Administration always been this heavily
staffed? To get the answer to this question we need to look at the historic
Financial Information Returns (FIR).
Owen Sound Workforce Growth
An interesting observation is that in the five years between 2016 and 2021 the total workforce, excluding Protective Services and Library, grew by 18 employees. This is a growth of 3.6 employees per year at a time when the population was relatively stagnant.
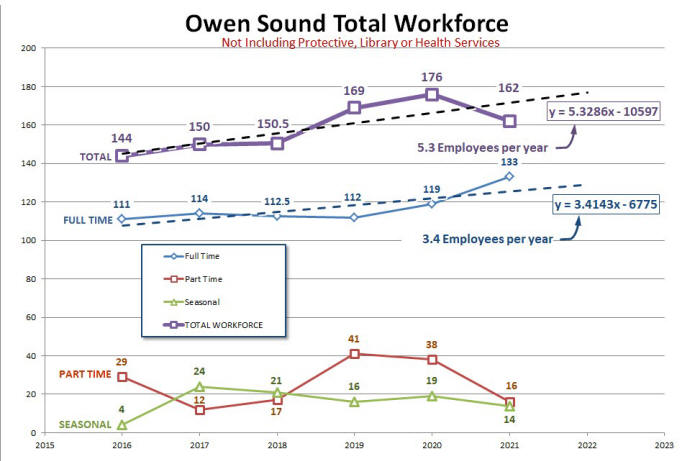 |
| Figure 26; Owen Sound Workforce Growth (2016 – 2021) Source: Financial Information Returns24 Also see Annex G |
It’s important for us to examine these changes in the workforce in more detail. Figure 26 below shows the annual changes by employee-type, that occurred between 2016 and 2021. We see that a preponderance of the changes occurred between 2019 and 2021. The number of full-time employees increased by 20 employees during this period; while the number of part-time employees decreased by 25 and the seasonal employees decreased by 2 employees.
The obvious impact of these changes was that 27 part-time and seasonal positions were converted to 20 full-time positions. This raises an important question. What was the process for converting part-time and seasonal positions to full-time positions? Does this conversion require the approval of Council?
Note: the decrease in the total workforce between 2020 and 2021 is quite likely the temporary impact that Covid had on staffing at city hall. It is quite likely that this will rebound in 2022.
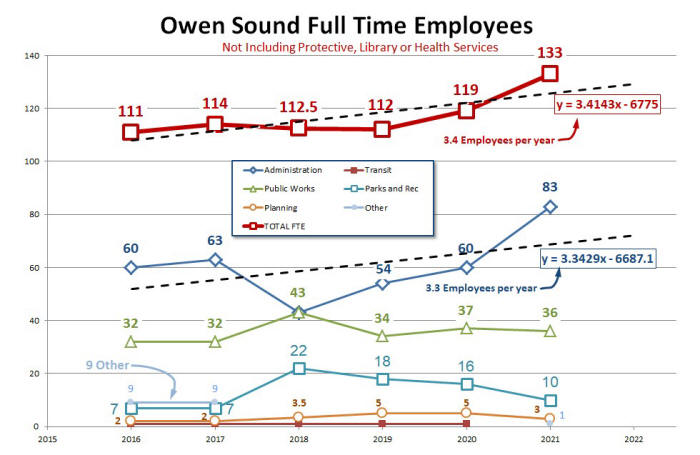 |
| Figure 27; Full Time Workforce Growth 2016 to 2021 Source: Ontario Financial Information Returns |
The full time employee trend line in Figure 27 (dotted line) shows us that the rate of increase of Full Time Employees between 2016 and 2021 was 3.4 employees per year. Note that Administration Department’s trend line shows us that the rate of increase in Administration was 3.3 employees per year which pretty much accounts for all of the annual workforce increases during this period.
In 2006 the workforce was more evenly distributed among the departments. At that time Administration represented 41.2% of the 119 employee workforce. Ten years later in 2016 Administration represented 54.0% of the 111 employee workforce which eventually grew to become 62.4% of the workforce with 83 employees. It appears that the population of administrators at city hall has grown at the expense of those employees working in the field.
 |
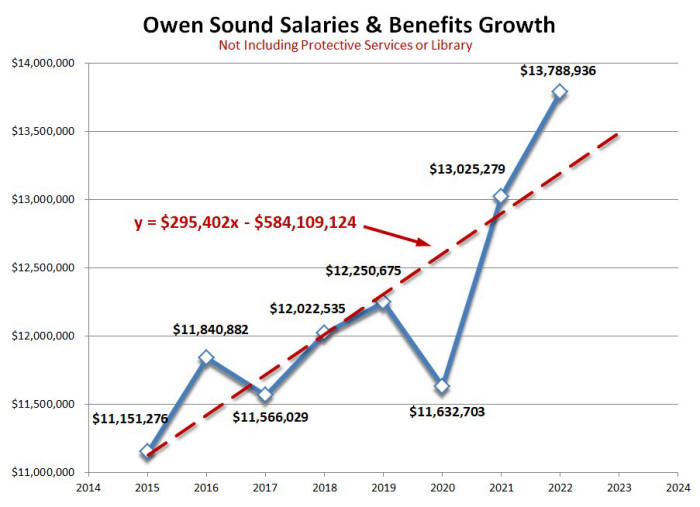 |
| Figure 28; Salaries & Benefits Expense Growth 2015 to 2021 Source: Audited Financial Statements |
The Salaries & Benefits trend line in figure 28 shows us that Salaries and Benefits Expense grew at a rate of $295,402 per year. If we divide this by $65,000, which an estimate for the average Salaries & Benefits per employee, we get an employee annual growth rate of 4.5 employees per year. This was calculated using the Salaries & Benefits data from the Audited Financial Statements includes annual salary increases which accounts for the difference from the3.4 employees calculated using the Financial Information Returns.
Examples of Overstaffing
 |
 |
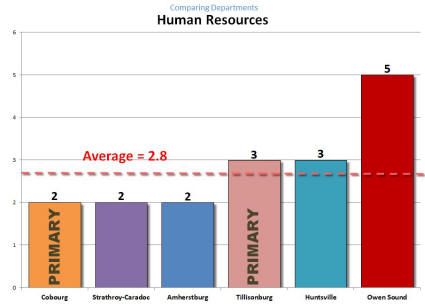
| Figure 29;Human Resources Department Source: Org Charts43-48 | Figure 30; Municipal Clerk’s Office Source: Org Charts43-48 |
There are discrepancies between Organization Charts that Owen Sound provided for this study and the 2021 Financial Information Report which makes it difficult to identify all of the sources for the overstaffing shown in figure 20. However, figures 29 to 31 show a few examples. For example Owen Sound is the only municipality in the study group employing two Human Resources managers and the only municipality with an HR Team of 5 employees. Owen Sound is also the only municipality employing three managers in the clerk’s office – see Annex B. As well Owen Sound is the only municipality employing both a Director and a Manager of Corporate Services in addition to a Deputy Treasurer.
The most alarming example of overstaffing however, is the staffing of the Art Gallery shown below in figure 22 which has twice the workforce as the average of the primary comparator municipalities. It’s noteworthy that the Owen Sound Org Chart at Annex E43 shows 8 staff working at the Gallery. Yet, the 2023 Budget Book 49 shows only six employees working at the Art Gallery.
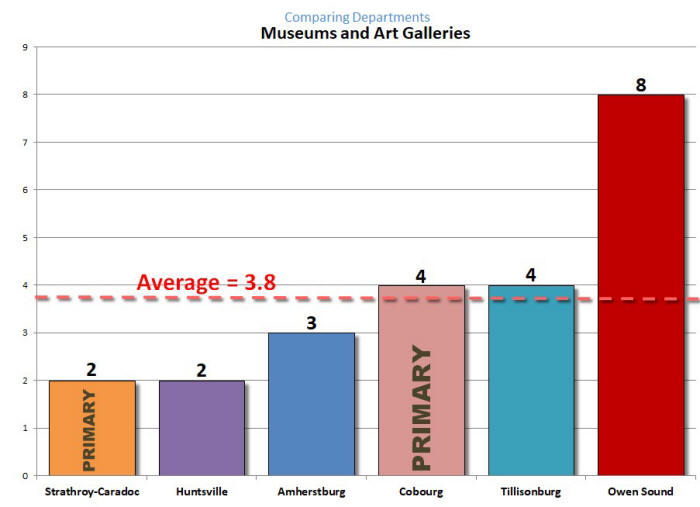 |
| Figure 31; Museums and Art Galleries Source: Organizations Charts43-48 |
|
SUMMARY |
|
| Read How Owen Sound's Services Compare |